|
|
|
|
|
|
|
|
|
|
|
|
AutoSoft Systems |
| |
|
|
|
AutoSoft
Systems |
2 Round Hill
Court |
| |
|
|
|
East Greenwich,
RI 02818 |
| |
|
|
|
401.885.3631 |
| |
|
|
|
401.884.5653 Fax |
| |
|
|
|
|
|
|
|
|
|
|
|
401.996.3631 Cell |
| AMDG |
|
|
|
Decision Ready
Information! |
autosoft@aol.com |
| Commercial & custom multi-user computer software for a
variety of applications including performance metrics, statistical analysis,
data extraction and merger from multiple large databases, computer simulation
and management information systems.
Founded in 1982. |
| We know Excel! Whenever possible, Excel
is the user interface, VBA is the programming language, ODBC connects to the
database of your choice. |
| Home |
About Us |
Literature |
Wire
& Cable |
Pharmaceutical
& Biotech |
Construction
Management |
Commercial
Products |
Custom Solutions |
| Contact Us |
Events |
Downloads |
| |
|
|
|
|
|
|
|
|
|
|
|
|
|
|
AMDG |
| AutoData
Process and Lab Information Management System |
| AutoData is a fully functional
Lab Information Management System [LIMS] for small workgroups (< 20
users). In addition, through the use of data acquisition hardware, AutoData
can incorporate process information into the same data base to allow for integrated
analysis of both process and lab data. |
| View
AutoData's Complete Instruction Manual (> 3 MBs) |
| |
AutoData is password protected, and provides multiple levels of
user access. |
| |
AutoData stores data on one or more servers, but allows each
user to operate independently. |
| |
Data entry is
quick and only 3 entry fields are required: |
● Sample/Product ID |
|
|
| |
|
|
|
|
|
● Test
Method/Attribute |
|
|
| |
|
|
|
|
|
● Result |
|
|
| |
|
|
|
|
|
|
|
|
|
|
|
|
|
|
|
| |
The user has the
option to pre-define additional fields: |
● Sample/Product
description |
|
|
| |
|
|
|
|
|
● Unit of
measure |
|
|
| |
|
|
|
|
|
● Specifications
(alarm & control limits) |
|
|
| |
(Additional
optional fields are available.) |
|
|
|
|
|
|
|
|
|
|
| |
The user has the option to display all pre-configured
specifications for a given Sample/Product. |
| |
Lookup functions assist the user in pinpointing a Sample/Product
or Test Method. |
| |
Extensive reports are available and can be view on-screen,
printed, or written to disk. |
| |
Automatic graphing of results is fully integrated with
Microsoft's ExcelŽ. |
| |
Site customization is available at fixed price quotes. |
| |
Source code is available. |
| |
Data acquisition
is through industry standard 4-20 milliamp and/or 0-10 VDC protocols. |
|
|
|
|
|
|
| |
One example of this is Thomas Engineering's
Compu-Lab. |
| |
|
|
|
|
|
|
|
|
|
|
|
|
|
|
|
| |
|
|
|
|
|
|
|
|
|
|
|
|
|
|
|
| Data Entry Screen: |
|
|
|
|
|

|
|
|
|
|
| Here the user first selects an IC Number (an Inventory Control
Number, a unique identifier of the item being tested, these are defined by
the user and can be any alpha-numeric identifier). Once the IC Number is
entered, a longer pre-defined description appears (in this case "Edible
Tallow"). The F5 button allows the user to search through the data base
if the IC number is not known. The lot number can then be optionally entered.
A date and time stamp is applied to the sample. The user then must identify
what test is being performed. Again these are all defined by the user. One or
many attributes can be assigned to each test method, which can be
quantitative or qualitative. The user then enters the test results in the
lower left grid, and the specification for each result appears at the lower
right. The equipment type and equipment can be optionally entered, and some
detailed notes can be entered as well. The user then clicks the desired
button in the upper right and the entry operation is complete. |
|
|
|
|
|
|
|
|
|
|
|
|
|
|
|
|
|
|
|
|
|
| Graphical Results Screen: |

|
|
|
|
|
| This screen is an example of the Microsoft Excel graph that
AutoData automatically generates. The user simply identifies the sample,
result, and date range desired, and with one click, AutoData searches the
data base for all matching entries, opens Microsoft Excel, imports the data
into Excel, and the AutoData.xlt template automatically generates the above
graph. Here, the blue dots represent the actual data points. The heavy blue
line represents the running average. The thin blue lines represent the running
deviation (2 sigma). The red lines represent the upper and lower control
limits. The purple lines represent the upper and lower alarm limits. This
file is a standard Excel file and can be further manipulated and saved by the
user if so desired. |
|
|
|
|
|
|
|
|
|
|
|
|
|
|
|
|
|
|
|
|
|

|
|
|
|
|
|
|
| This screen is generated in a similar fashion to the prior
chart. Here, the blue line is a histogram the actual data points. The solid red lines represent the upper and
lower control limits, and dotted red lines represent the alarm limits. The
thin dotted lines represent a 1 sigma and 3 sigma distribution. This allows the user to rapidly determine
how well the actual process is conforming to a standard distribution
function. This file is a standard Excel file and can be further manipulated
and saved by the user if so desired. |
|
|
|
|
|
|
|
|
|
|
|
|
|
|
|
|
|
|
|
|
|
|
|
| Inventory: |

|
|
|
|
|
|
| There is an inventory module that allows for rapid sorting and
retrieval of information. |
|
|
|
|
|
|
|
| |
|
|
|
|
|
|
|
|
|
|
|
|
|
|
|

| Quality Assurance Specifications: |
|
|
|
|
|
|
|
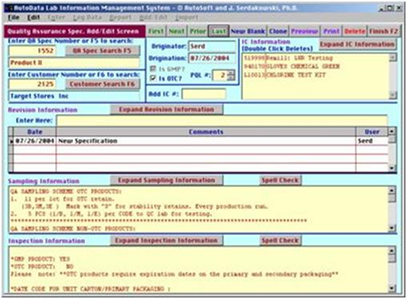
| A flexible and
comprehensive Quality Assurance module is included: |
|
|
|
|
|
|
| AutoData can be leased for a low installation fee that includes
on-site training and configuration, and a monthly fee that includes unlimited
technical support and upgrades. |
| |
|
|
|
|
|
|
|
|
|
|
|
|
|
|
|
| AutoSoft Systems | 2 Round Hill Court, East
Greenwich, Rhode Island, USA 02818 | 401.885.3631 | Fax: 401.884.5653 |
Mobile: 401.996.3631 |
| This web page was last updated at 02/21/2014 07:56 AM and is
written in EXCEL! |
| AXIOM is a Trademark of Consona - USYS is a Trademark of Zumbach
- AutoSoft Systems is not affiliated with Consona nor Zumbach |
|
|
|
|
|
|
|
|
|
|
|
|
|
|
|
|


